Stress testin’, bug fixin’, refinin’
I’ve decided to setup a benchmark scene.
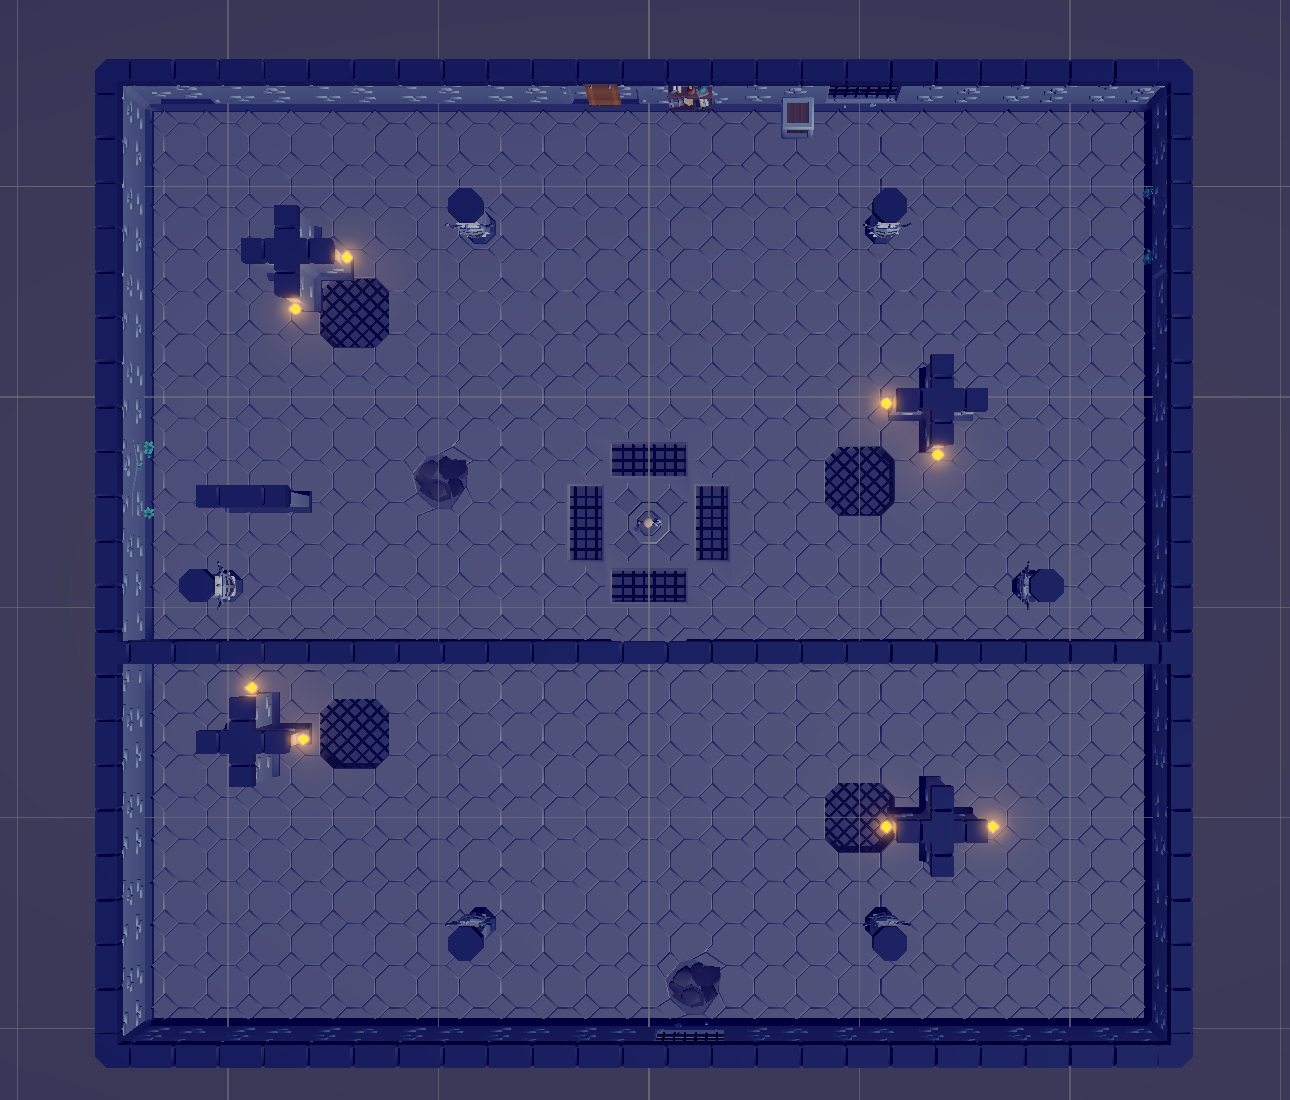
The level is a big square with enemy spawners at the 4 cardinal points.
”Exploding” Inertial Blends
I’ve started by implemented a simple spawner for the skeletons.
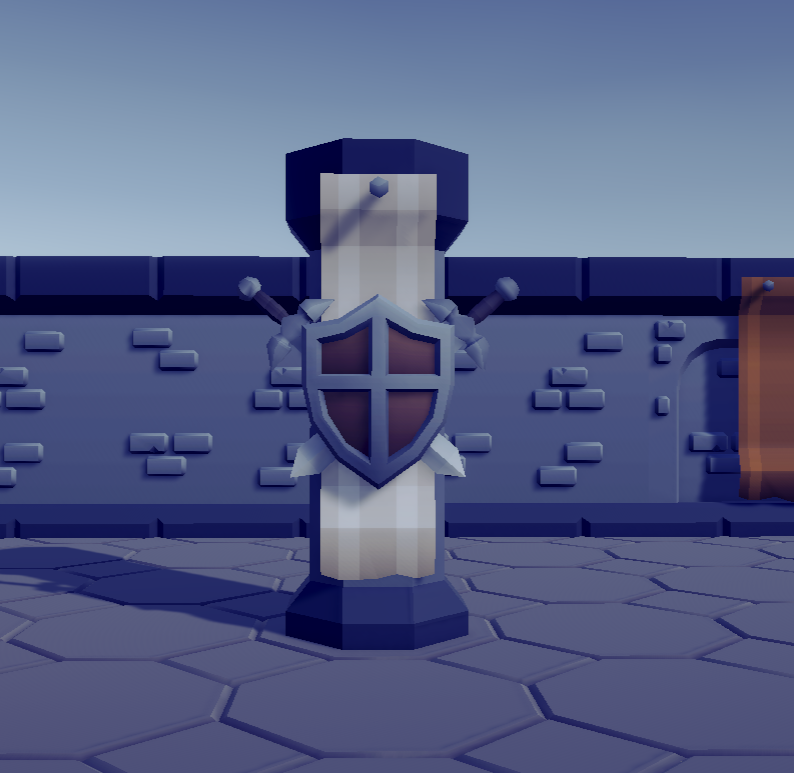
I spawns skeletons every seconds and, while testing, boom! Something weird was happening. At first, it looked like flickering. Looking at it frame by frame, I could definitely see some gigantic polygons with each spawned skeletons.
My first guess was that it had something to do with inertial blending. I already saw some weird glitching on the character when I was implementing it.
I then proceeded to have a second (third, fourth, …) at the documentation and stumbled on this:
Optimized skeletons require an initialization step. […] but if the entity was instantiated after this point in the frame (sometime during SimulationSystemGroup), you may need to initialize the entity manually via the ForceInitialize() method.
Adding this to the spawner super system didn’t help but didn’t hurt either.
   [UpdateInGroup(typeof(PostSyncPointGroup))]
   [UpdateBefore(typeof(MotionHistoryUpdateSuperSystem))]
What fixed the issue was tweaking the checks for inertial blending inside FourDirectionAnimationSystem and defaulting the InertialBlendStatecomponent’s PreviousDeltaTime to -1, treating it has uninitialized.
    // Detect significant direction/movement change (for starting new blend)
    var significantChange = math.abs(
    math.length(velocity.xz) - math.length(previousVelocity.Value.xz)) > inertialBlendState.VelocityChangeThreshold;

    // Start new inertial blend when movement changes significantly
    if (significantChange)
    if (significantChange && inertialBlendState.PreviousDeltaTime > 0f)
    {
        skeleton.StartNewInertialBlend(inertialBlendState.PreviousDeltaTime, inertialBlendState.Duration);
        inertialBlendState.TimeInCurrentState = 0f;
    }

    // Apply inertial blend with current time since blend started
    if (inertialBlendState.TimeInCurrentState <= inertialBlendState.Duration)
    if (!skeleton.IsFinishedWithInertialBlend(inertialBlendState.TimeInCurrentState))
    {

        inertialBlendState.TimeInCurrentState += DeltaTime;
        skeleton.InertialBlend(inertialBlendState.TimeInCurrentState);
    }
Vector Field’s Grid
I wanted to have a more fine grained vector field grid constructions.
Until now, to build the grid, a bunch of raycasts were sent to the EnvironmentCollisionLayer. If it hits, it meant that it was hitting the level and, so, it meant it was walkable… Meaning that if it hits a wall, it was treated as walkable too. 😕
My solution may not be the smartest nor the simplest but it worked.
Step by step:
- Add a
NavMesh Modifierto every prefabs that are used in the level. - Add a
NavMesh Surfaceto a game object in the scene. - Create an editor script that will turn the
NavMeshinto aMeshCollider - Exclude this
MeshColliderfrom theEnvironmentCollisionLayerand add it to a custom layer. - Raycast hit to build the grid.
And… Nope. The generated mesh was okay but, using Psyshocks visual debugging tools, I could see that the collider was missing half its triangles.
Step by step part 2:
- Feel a bit stupid.
- Ask for help on the discord and feel a bit more stupid (personal issue with asking for help, working on it. Latios’ community is awesome).
- Debug the hell out of it.
- Find a regression in Latios’s
TriMeshColliderbaking. - Feel like a real open source contributor!
Enemies getting NaN’d and Path Following enhancements
JavaScript PTSD kicking in. Who would have thought that a simple float2 could be NaN in C#? I’ve tried to look for answers on the internet but couldn’t find anything.
I’m guessing that it is due to some of Unity.Mathematics’s optimizations and me normalizing zero-length float2s.
Which system was moving the enemies? Well, it is Anna’s SolveSystem but I was pretty sure that this system was doing its job.
On the other hand, my quick and dirty FollowPlayerSystem was probably not taking into account every cases where the vector math could result to NaNs.
So, as a first step, I added a bunch of checks. I just discovered that there was a bool2 math.isnan(float2 x) function.
Next, I took another direction (while still leaving the checks in place), adding more methods to the grid and realized I didn’t used Latios’ ICollectionAspect yet.
ICollectionAspect makes a lot of sense. First, it’s quite ugly having components that acts like your average corporate 2.5k lines Java class.
From what I understand, components, in ECS, are supposed to be data containers. Unity’s IAspect is quite elegant to help bridging the DoD and OOPS worlds. Latios’ ICollectionAspect does this for your ICollectionComponent.
Yes. I got sidetracked but I added bilinear interpolation to the VectorFieldAspect. I also added a float2 GetVectorSafe(int2 cellPos) that returns float2.zeroif out of bounds.
Sampling the vector field with bilinear interpolation and clamping the result to the grid size should be enough to avoid NaNs and get smoother path following.
Being a N00B
Part 1 - Mixing Psyshock’s compound colliders and Anna’s EnvironmentCollisionLayer
With this done, I started to stress test the game. I added a bunch of skeletons and… performance was dropping quickly.
Back to the Discord to ask for help. Dreaming had a look at my scene and… Oops.
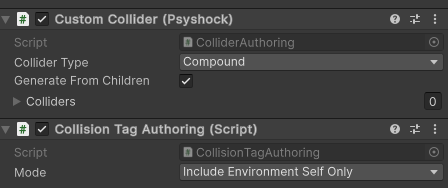
Dreaming: And I found your performance problem.
Compound colliders in Psyshock don’t have any acceleration structure currently. So stuffing the entire level into a single compound defeats all the optimizations.
What you probably want is to set the Collision Tag Authoring to Include Environment Recursively, and then delete the Custom Collider.
Much better!
Part 2 - AddComponentsCommandBuffer cannot add zero-sized components
Well, it can’t… but it can anyway.
AT first, in the job that checks for collisions between the axe and the ennemies, I tried to use AddComponentsCommandBuffer in this way:
var addComponentsCommandBuffer =
    m_latiosWorldUnmanaged.syncPoint.CreateAddComponentsCommandBuffer<HitInfos, DeadTag>(AddComponentsDestroyedEntityResolution.DropData);
DeadTag being a zero-sized component. I was getting yelled at by the compiler. So, I resorted to pass another ECB to the job on top of this one.
Dreaming :
I noticed you missed this API in your recent blog: AddComponentsCommandBuffer.cs#L107

Fixed!
    var addComponentsCommandBuffer =
        m_latiosWorldUnmanaged.syncPoint.CreateAddComponentsCommandBuffer<HitInfos>(AddComponentsDestroyedEntityResolution.DropData);

    // Auto-magically add DeadTag when adding HitInfos !
    addComponentsCommandBuffer.AddComponentTag<DeadTag>();
Already better but…
Part 3 - What to do when benchmarking
Dreaming :
You may have safety checks, jobs debugger, and leak detection enabled (always disable these when benchmarking)> You may have safety checks, jobs debugger, and leak detection enabled (always disable these when benchmarking)
Well, yes. And VSync is on too.
And I need more RAM. Typing this in VSCode while Burst Compiling feels like using a cloud based IDE.


Nice, burst is done compiling. I can finally use the 12% RAM left 🤩
And I need to move a lot of junk from the SSD to the external SSD because the profiler is constantly complaining about pagefile and disk usage (and RAM).

Benchmarking Checklist:
- Safety checks disabled
- Jobs debugger disabled
- Leak detection disabled
- Native Debug Compilation disabled
- All entities windows closed
Dreaming’s “Reading the Timeline” Masterclass
Dreaming was kind enough to share his profiling breakdown with me and the community. It is so detailed that I thought it would be a good idea to share it here.
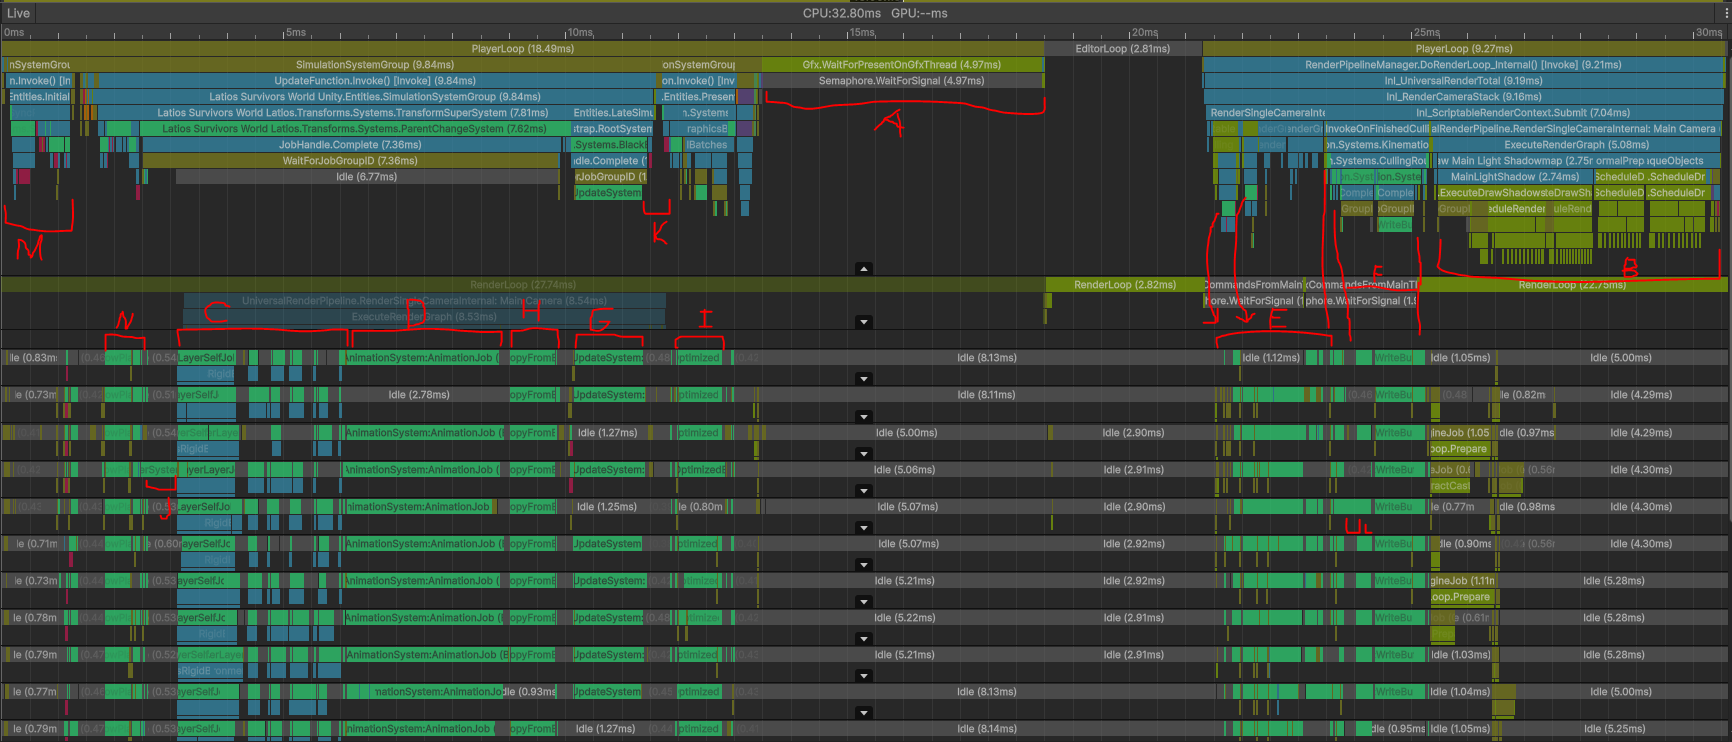
Dreaming’s Annotated Timeline with around 3k enemies
He used this revision 9e96dee,
removed a Debug.Log that I let slip through, changed the Cascade Count from 4 to 2 in the “Pc_RPAsset” and put the spawn rated to an interval of 0.1 seconds to reach a high number of moving enemies quickly.
A: Semaphore.WaitForSignal

This marker is a tell-tale sign of being GPU bound, either due to excessive uploads or excessive rendering. In this case, it is the latter due to the high poly count on the enemies. LOD Groups are definitely needed.
I guess I should investigate LOD Groups ASAP.
B: Big Batch
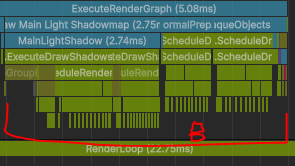
This batch being this big can mean one of three things:
- Too much transparency - not the case here
- Poor chunk capacity and/or utilization - also not the case here
- GPU-bound - our case (and I have no idea why being GPU-bound makes this task take a lot longer, but it does)
C: Anna’s Update
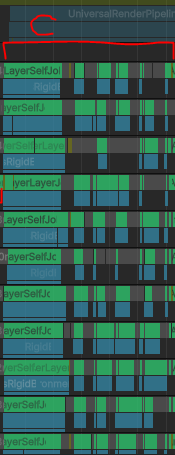
This is Anna’s update. It takes 3 milliseconds to perform the full simulation, which is a little pricy, but then again, that’s 3000 rigid bodies all fighting to reach the player, so there is a lot going on. The thread distribution is a lot better, as this used to take 5 milliseconds.
However, a third of the time is being spent on contact generation between the capsules, and the other two thirds on solving it (with some gaps), so there’s probably some narrow phase optimization potential there. I’d need a sampling profile to investigate further though.
D: Animation Processing
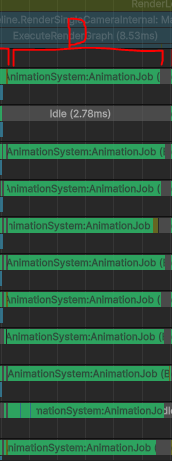
Animation is processing 150k bones in 3 milliseconds, which is a little slow on my PC. I’m unsure if this is sampling or inertial blending. Again, I’d need a sampling profiler to determine that.
E: Culling

The two batches of culling jobs are perfectly taking just enough time to end right around the time URP finishes setting up the render graph and is ready to start the dispatch phase.
F: Dispatch

The dispatch phase is bottlenecked primarily by uploading the skeletons to the GPU. That’s not surprising if you’ve seen what this benchmark looks like in the game view.
G: Transforms Updates

Transform updating is very close to the threshold where switching to extreme transforms might be better. However, I suspect a lot of this may be due to H.
H: Sockets Updates

There are a high number of sockets updating, and it seems most of these sockets are unused at this time. So this could probably be made smaller.
I: Culling Bounds Updates

Updating culling bounds for 150k bones is a lot, but most likely I don’t have the most optimal algorithm in place for doing this. That might be a potential optimization in the future when it is high enough priority.
J: Axis Locking

This is a bubble in Anna’s setup specifically due to axis locking. This is because writing locking and joint constraint pairs to a PairStream is a single-threaded operation. I think I will probably need to improve this at some point and allow writing arbitrary pairs in parallel somehow.
K: Sync Point
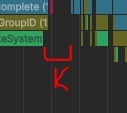
It is super common for projects to introduce a sync point like this. This is syncing on transforms because the main thread is copying the transform into a location that GameObjects can read (and in this case, for the Cinemachine target)
L: Another Bubble

Another bubble, this time in dispatch due to the high number of skeletons. In this case the bubble is fairly small, but it is something I’ve been watching for a while in case I need to switch up the approach. This bubble can be easily filled by using blend shapes, dynamic and unique meshes, and Calligraphics. Material property uploads tried to fill the bubble, but they didn’t have enough work to do.
M: Another Sync Point

This is the primary structural change sync point, which takes 1 millisecond. I’m not worried about it, because I’ve increased the spawn rate by 10x, so it is a little exaggerated.
N: I’m not blushing

Fast gameplay code is fast. Kudos!

We’ll see when there will be more stuff happening…
LOD Groups
Kinemation can bake Unity’s LOD Groups for skinned meshes.
Reading at the Unity documentation, it looks like assigning meshes to a LOD group can be simplified by prefixing every meshes with LOD0, LOD1, LOD2, etc.
I then proceeded to import the skeleton fbx into Blender and duplicate each mesh, renaming them with the prefix applying a “decimate” modifier to each of them… And was wondering “someone must already have automated this”.
Yes, someone did! Multiple people did, in fact.
I’ve found this blender addon LODs Maker that does exactly what I was looking for. It even has a handy button to “apply transforms” so that Kinemation’s LOD baker won’t complain about having meshes with different world transforms.
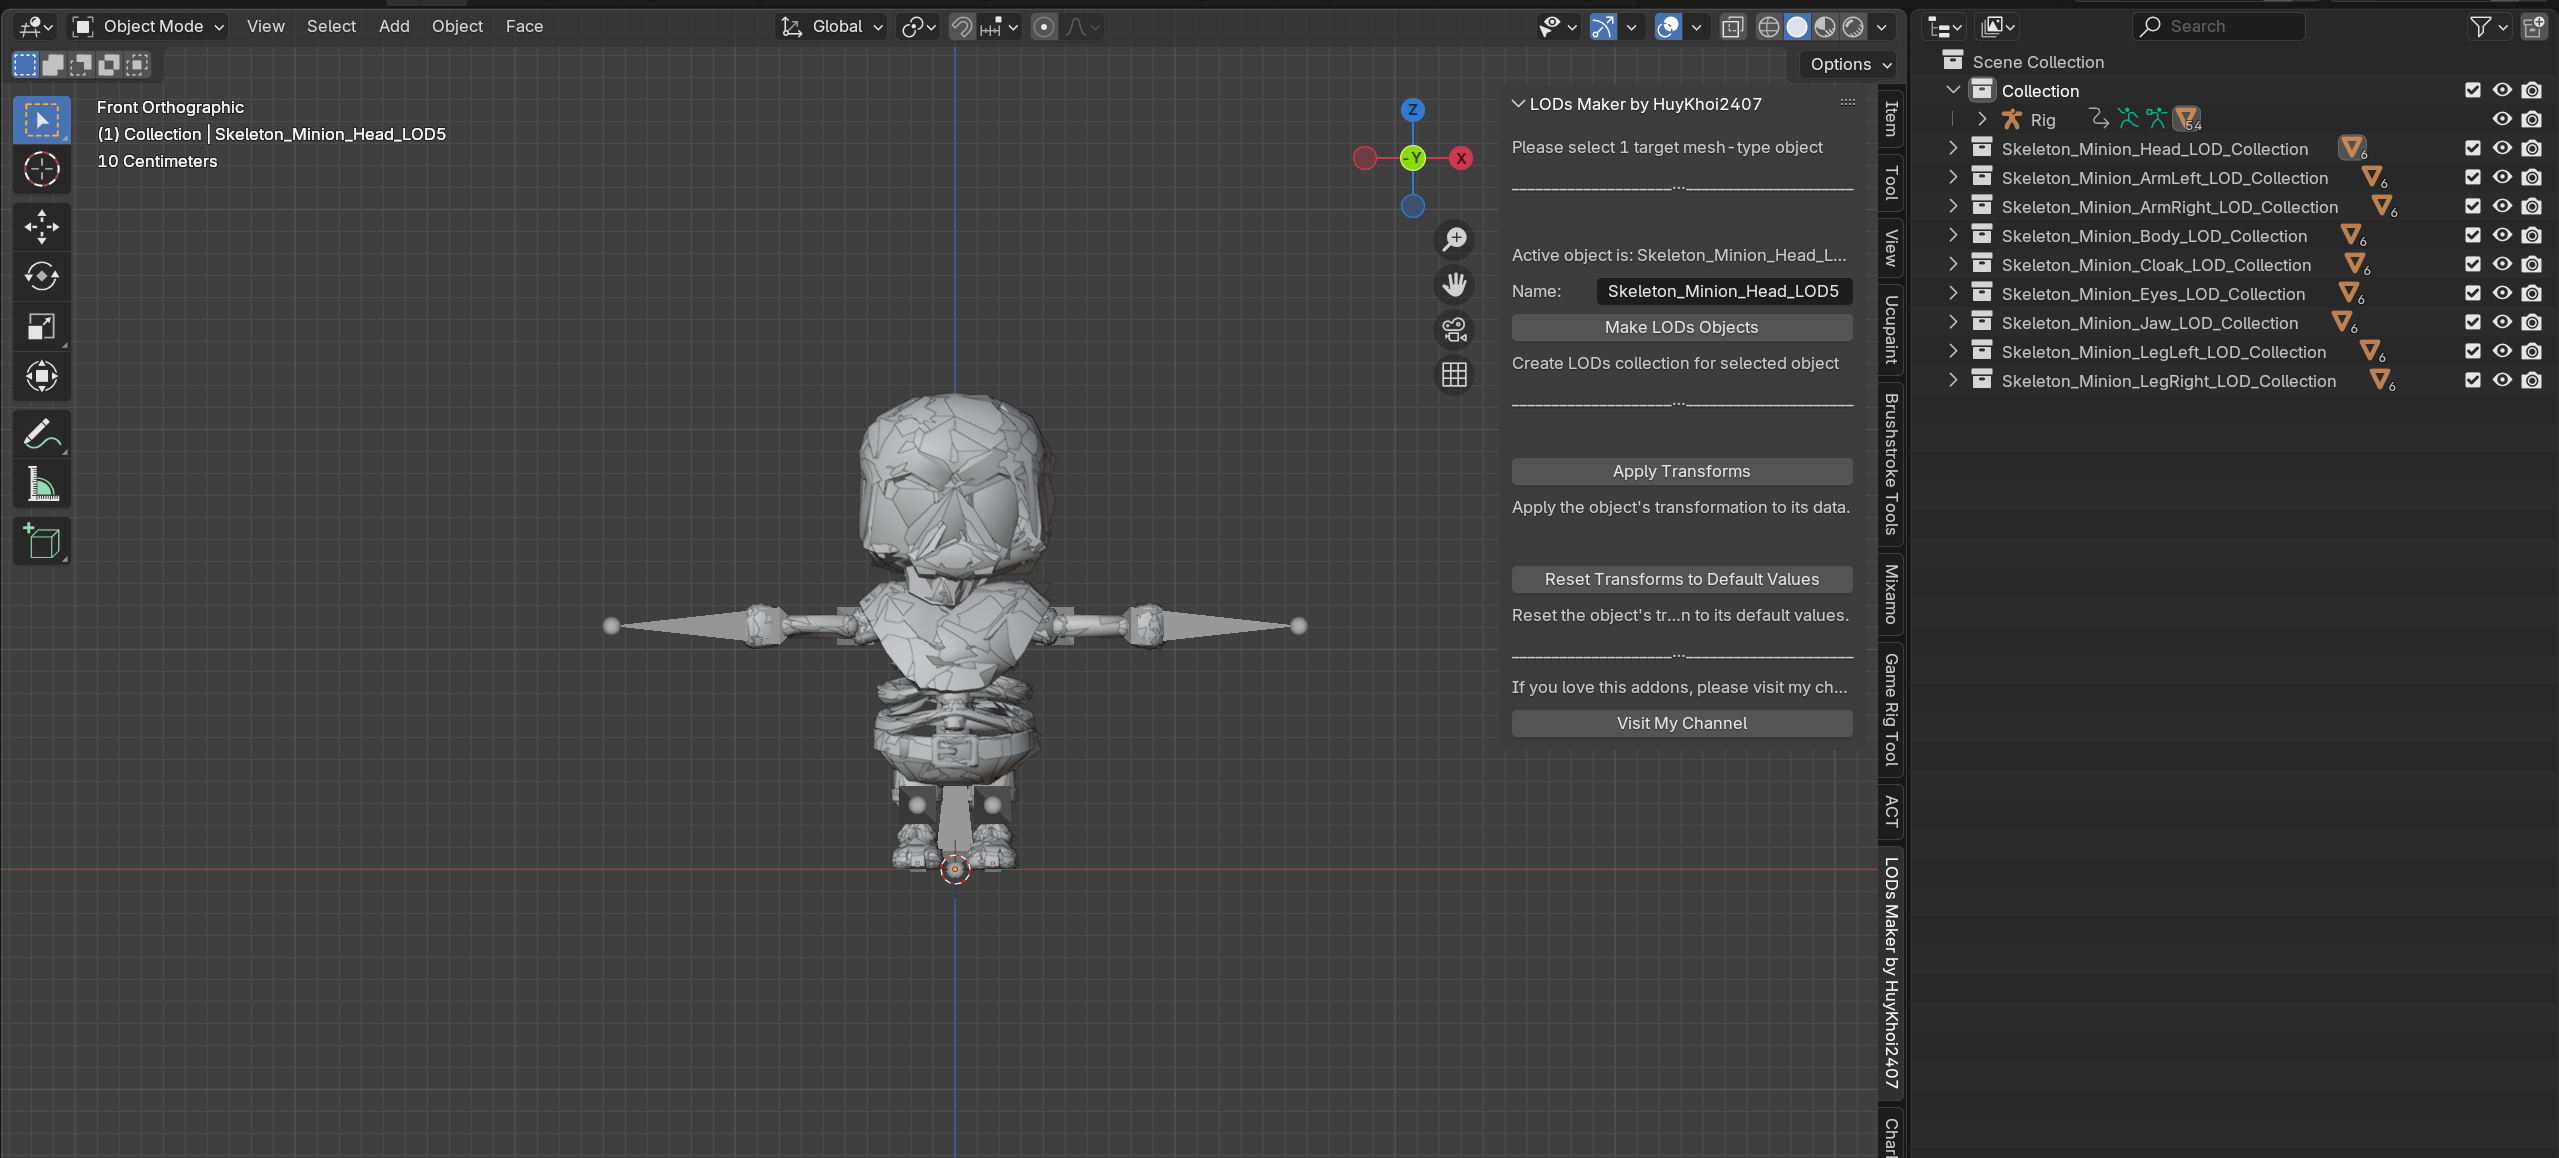
That was quick!
Giving it a “benchmark” try, I was able to fill the benchmark scene with more skeletons than it can contain… and with pretty low FPS but that is already 4 times better than before.
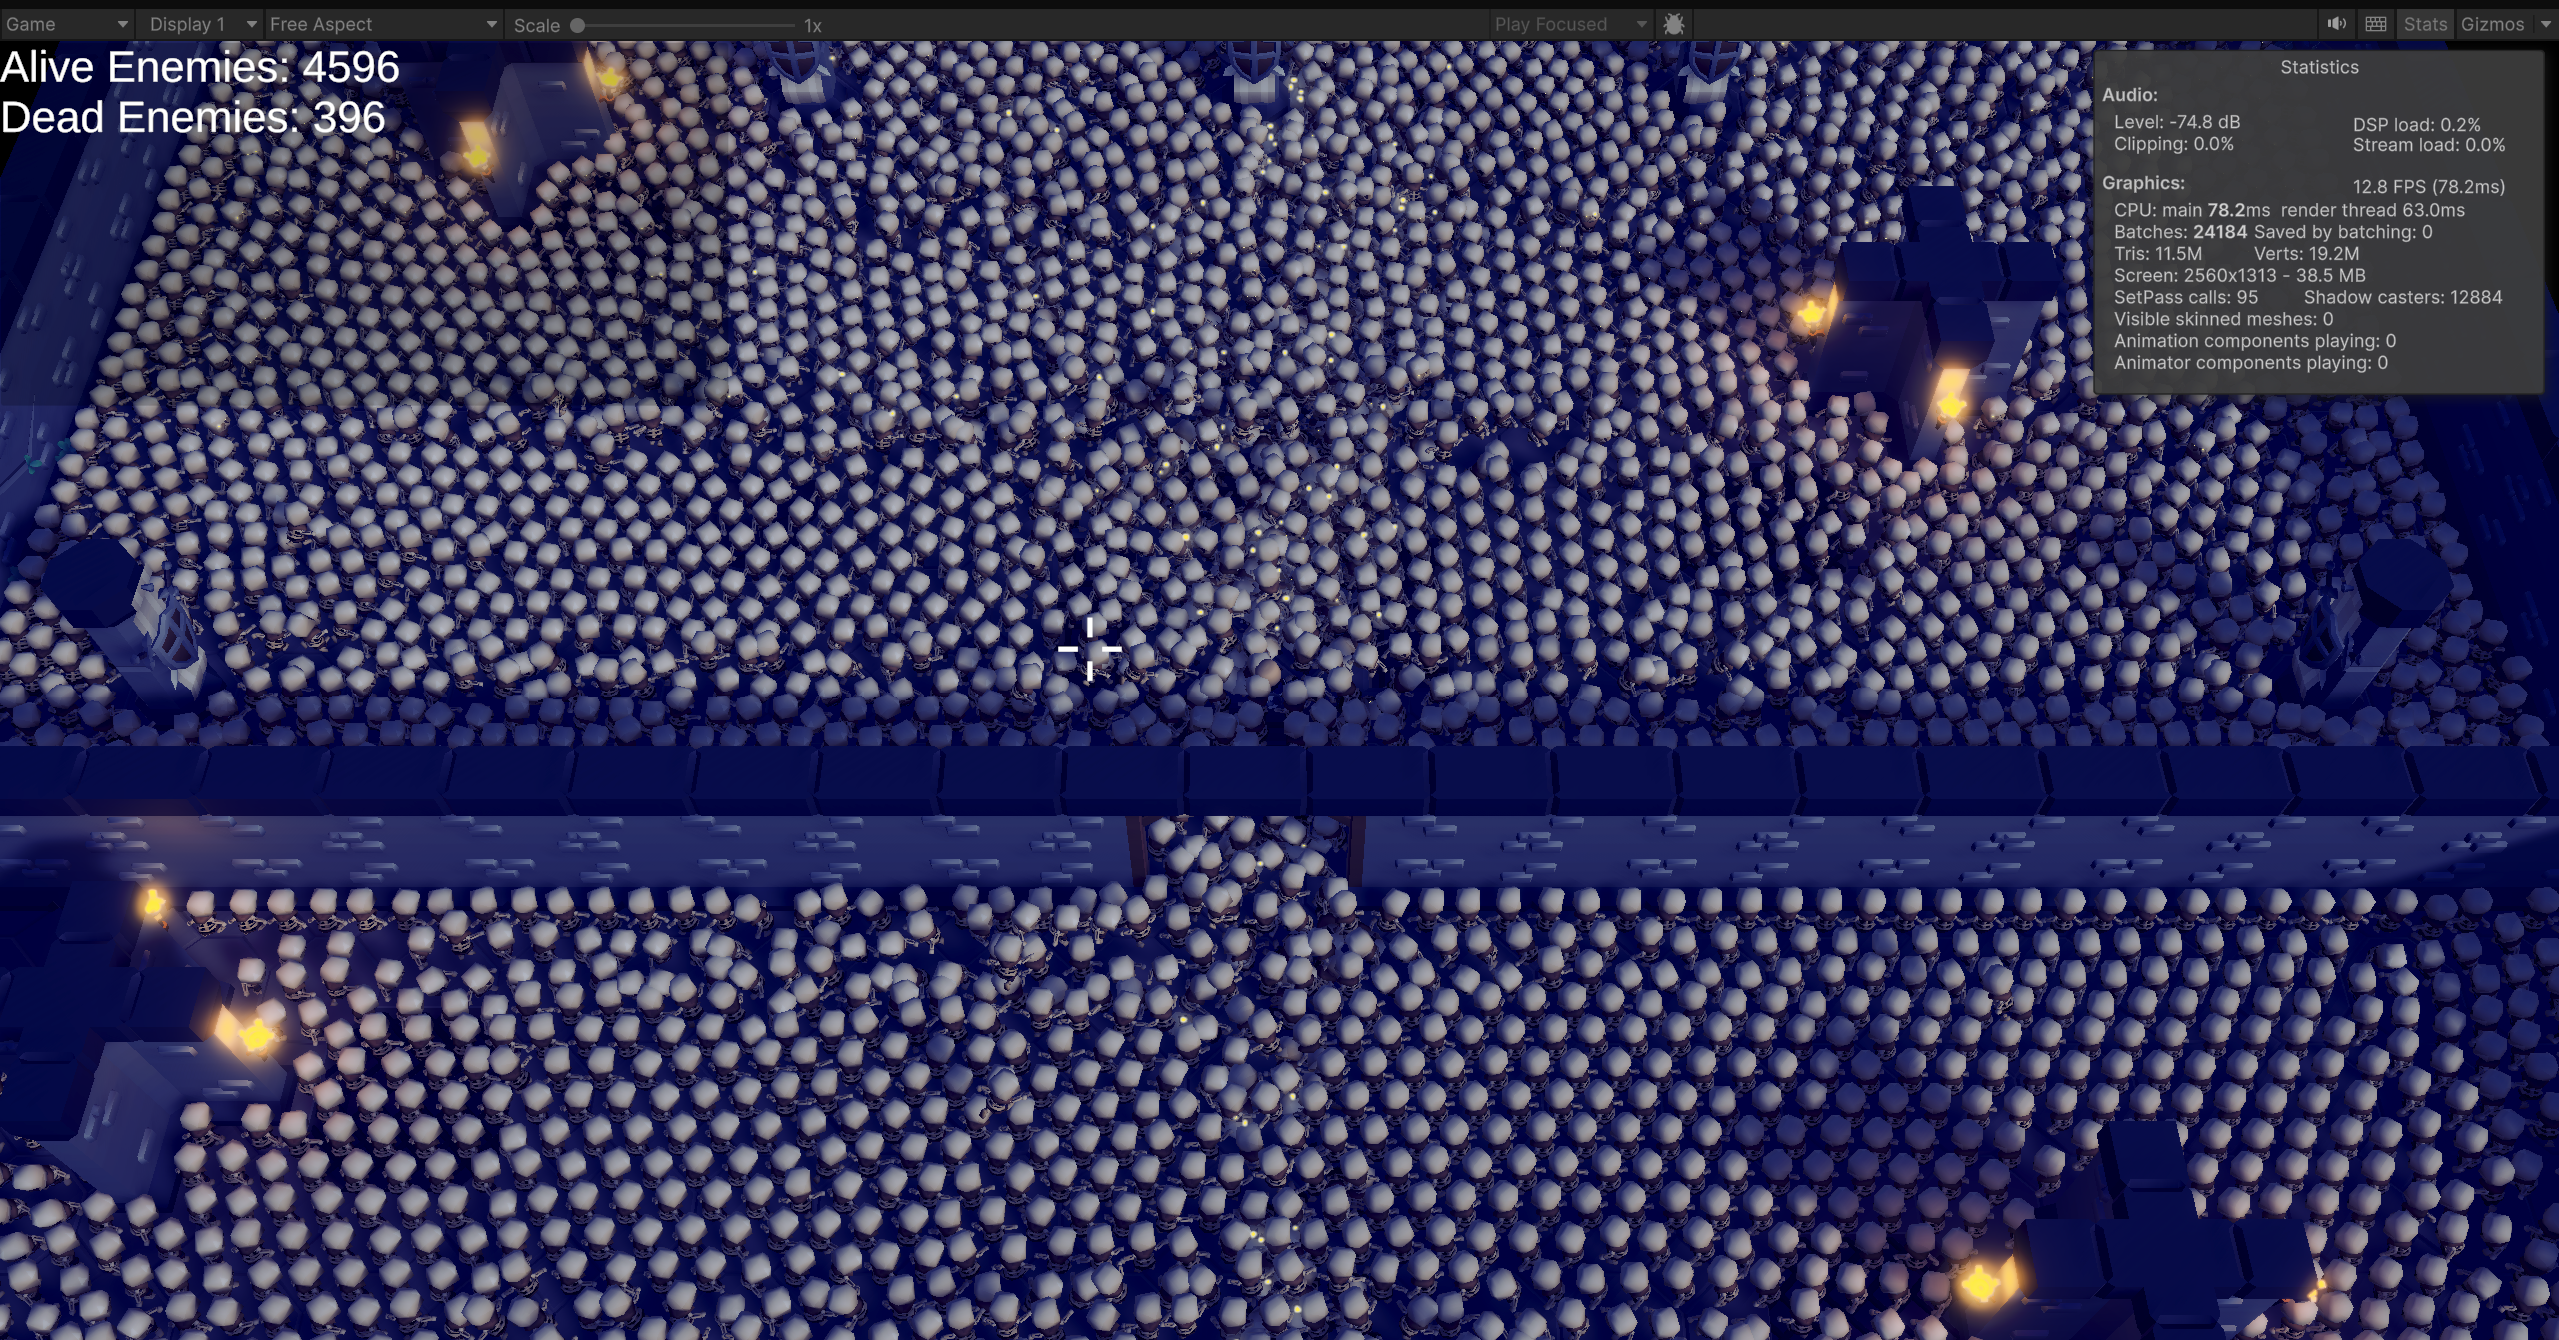
We are full!
Conclusion
That was a short article but it was fun to write and especially awesome to have Dreaming helping me out with the issues I was having and look at my code.
His timeline breakdown was super interesting and I learned a lot from it.